Battery Cycle Life Prediction: Methods, Accuracy and Limitations
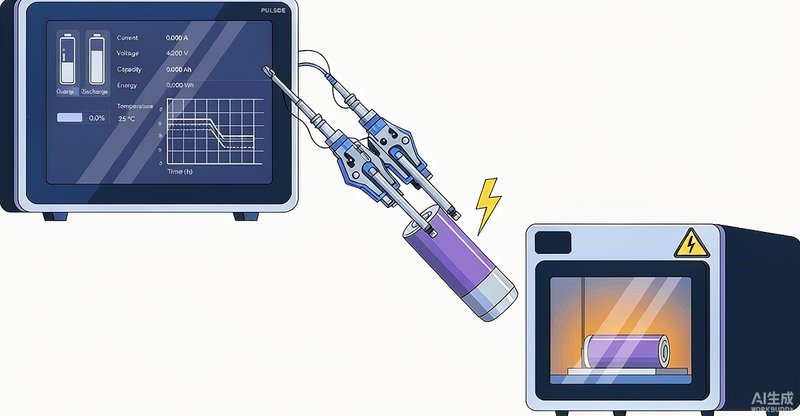
A 2000-cycle life test takes months and costs thousands of dollars. Accelerated testing promises answers in weeks. But no accelerated test is perfectly accurate — understanding its limitations is what separates useful predictions from wasted engineering time.
1. Full Cycle-Life Testing: The Baseline
The gold standard is running cells through actual charge/discharge cycles at use-case conditions until capacity drops below the end-of-life threshold (typically 80% of initial). For EV cells with 1000+ cycle requirements at 1C, this means 1000+ cycles, taking approximately 42 days of continuous operation.
2. Accelerated Cycling and Extrapolation
Accelerated cycle-life testing raises current rate, temperature or depth of discharge to speed up degradation. A common approach is to test at 2C–3C and extrapolate to 1C life using Arrhenius-based models. However, degradation mechanisms differ at accelerated vs. normal conditions, and extrapolated predictions can underestimate actual cycle life by 20–40% if not carefully validated.
3. Electrochemical Impedance Spectroscopy (EIS) Prediction
EIS measures the cell's impedance across a wide frequency range (1 mHz to 100 kHz) and extracts parameters like charge transfer resistance and SEI resistance. Tracking these over 100–500 cycles and fitting them to degradation models can predict end-of-life before it actually occurs. VoltTest's VT-IR series testers support EIS measurement as an option.
4. Calendar Life vs. Cycle Life
Calendar life (SOC-dependent aging at rest) and cycle life (SOC-dependent aging during cycling) are related but distinct. A cell stored at 100% SOC and 40 °C may lose capacity faster than a cell cycled daily at 25 °C. Accurate battery life prediction must account for both mechanisms.
5. Practical Accuracy and Limitations
Real-world battery cycle life predictions should be treated as estimates, not exact numbers. A well-designed accelerated test with proper Arrhenius correction typically predicts cycle life within ±20% accuracy. Statistical sampling (minimum 30 cells) is essential for reliable prediction.
6. Choosing a Prediction Method
For initial product development: accelerated cycling with EIS tracking (weeks, moderate cost, ±20% accuracy). For customer qualification: full cycle-life testing (months, definitive). For production monitoring: periodic EIS measurements and statistical process control.
12. Frequently Asked Questions
- ✓What is the typical accuracy requirement for my application? Most R&D labs require ±0.05% FS for cycle life testing. For production line QC, ±0.1% FS may be sufficient. Always match accuracy to your test requirements.
- ✓How often should test equipment be calibrated? Annual calibration is standard for most applications. Heavy-use labs (≥16 hrs/day) should calibrate every 6 months. ISO 17025 accreditation is recommended.
- ✓Can I use one system for both cells and packs? Yes, modular systems like VT-CDS can be configured with different voltage ranges. Ensure the cabinet has sufficient channel density and power supply capacity.
- ✓What about energy recovery efficiency? Modern regenerative cyclers achieve 90-95% energy recovery. This can reduce electricity costs by 60-80% during formation and cycle life testing.